How to profile a React Native app
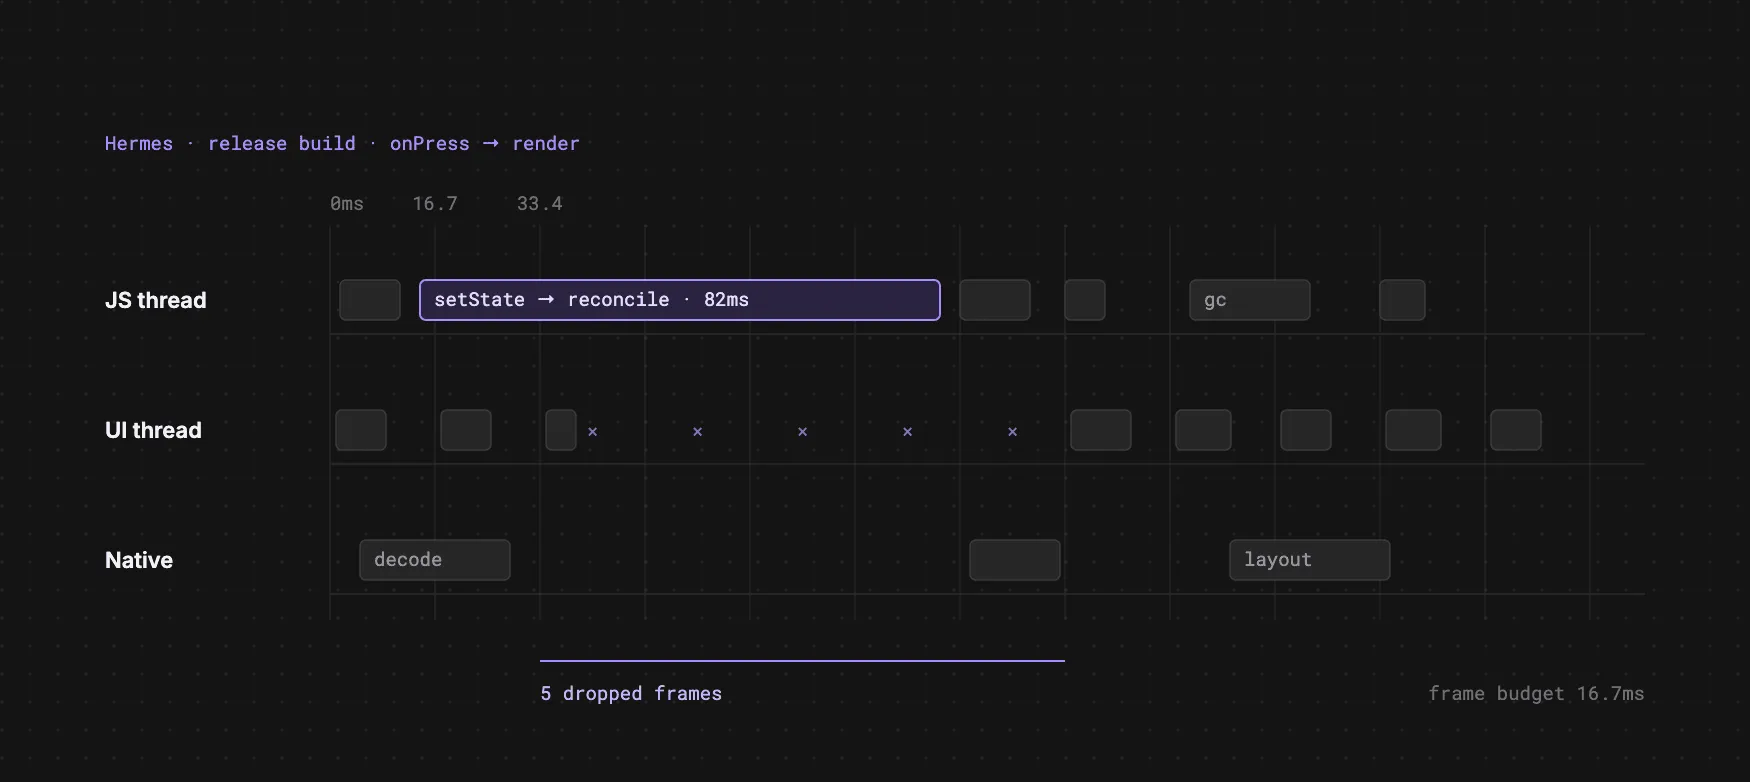
React Native performance profiling can be awkward when you first get into it because there isn’t one magic profiler that tells you everything.
When a screen feels slow, stutters during navigation, or hangs when switching tabs, the problem could be React rendering. It could be the JS thread. It could be layout, text rendering, the UI thread, Hermes GC, or a weird mix of a few of them.
This is why I don’t like relying on a single profiler for React Native performance work. If you only look at one layer, it’s very easy to spend a day optimizing the wrong thing.
The workflow I normally use is:
- React DevTools for rerenders and commit evidence
- Xcode Instruments or
xcrun xctracefor iOS native evidence - Android Studio Profiler for Android native evidence
- SpeedScope, Perfetto, or Margelo’s
react-native-release-profilerwhen I need exported traces or release-build numbers
This post is the routine I use when I want to prove where the time is going instead of just poking around and hoping the app feels better afterwards.
I’ll use Expo dev client commands in the examples because they’re easy to follow, but the process is not Expo-specific.
Start with one exact flow
The biggest mistake I see with profiling is comparing random app usage.
If you want numbers that mean anything, you need to repeat the same flow every time.
Some good examples are:
- cold launch to a specific screen
- opening a list and navigating to a detail screen
- switching between two tabs on the same screen
- opening a heavy screen, waiting for it to settle, then switching to another screen
Keep the following as consistent as possible:
- simulator or device
- OS version
- build type (development or release)
- network conditions
- exact taps and waits
If you change the flow between runs, the data gets noisy very quickly.
Start the app properly
For Expo dev client apps, the startup flow is usually:
bun run startand in another terminal:
bun run iosor:
bun run androidIf you’ve only changed JS / TS code, a reload is often enough for another profiling pass.
If you’ve changed native config, or you want a stricter before / after comparison, do a clean rebuild first:
rm -rf ios android
bunx expo prebuild -p ios
bun run ios
Then in another terminal:
bun run startReact DevTools
React DevTools is usually where I start because it answers one question quickly:
is this screen slow because React is doing too much work?
On newer React Native versions you can often get this through React Native DevTools. If you need the standalone version, run:
bunx react-devtoolsThen:
- Open the
Profilertab - Click
Start profiling - Perform the exact flow
- Click
Stop profiling - Save or export the profile if you can
The things I normally look for are:
- total commit count
- slowest commit
- repeated commits during initial navigation
- components rerendering more than expected
- rerenders on screen switch that should really only happen on mount
If one small interaction causes loads of commits, that’s usually a good clue that the issue is in React land.
Some common causes are:
- recreated context values
- rebuilt arrays or objects on every render
- unstable callback props
onLayout -> setState -> rerenderloops- heavy text-based subtrees
This is especially useful for narrowing down components like:
- tab bars
- calendars
- headers
- cards
- dropdown triggers
- large lists
React DevTools is great for rerender evidence, but it does not replace native profiling. Once React looks reasonable, the next question is what is happening on the native side
Xcode Instruments on iOS
On iOS, Instruments gives you native evidence for things like:
- CPU usage
- hangs
- memory leaks
- UI thread pressure
- suspicious call stacks
If you’re new to Instruments, start with:
Time ProfilerHangsLeaks
The normal GUI workflow is:
- Launch the app first
- Open
Xcode > Open Developer Tool > Instruments - Create a new recording
- Choose
Time Profiler - Add
Hangs - Add
Leaks - Select the running simulator or device
- Attach to your app process
- Click Record
- Perform the exact flow
- Stop and save the trace
If you don’t know where to start, Time Profiler is usually the safest default.
No Recording Options Available
Sometimes Instruments opens and says No Recording Options Available.
Most of the time that just means Instruments does not have a valid target.
Common causes:
- you opened an old
.traceinstead of a fresh recording - no simulator or device is selected
- the app is not running
- no process is attached
- Instruments lost its connection to the simulator
If that happens, I usually do this:
- Quit Instruments
- Quit Simulator
- Relaunch the app
- Open Instruments fresh
- Create a new
Time Profilerrecording - Re-select the target and process
If Instruments is still being awkward, I usually stop fighting the UI and use xctrace.
xctrace
The CLI version is often more reliable than the Instruments UI when you just want a clean trace.
Useful commands:
xcrun xctrace version
xcrun xctrace list devices
xcrun xctrace list templates
xcrun xctrace help record
xcrun xctrace help export
Here’s an example Time Profiler recording:
xcrun xctrace record \
  --template 'Time Profiler' \
  --device 'iPhone 17' \
  --attach 'MyApp' \
  --output /tmp/myapp-profile.trace \
  --time-limit 30s
While it records, perform the flow manually.
If attaching by process name doesn’t work, get the PID:
pgrep -fl MyAppThen attach by PID:
xcrun xctrace record \
  --template 'Time Profiler' \
  --device 'iPhone 17' \
  --attach 12345 \
  --output /tmp/myapp-profile.trace \
  --time-limit 30s
You can also try adding Hangs and Leaks:
xcrun xctrace record \
  --template 'Time Profiler' \
  --instrument 'Hangs' \
  --instrument 'Leaks' \
  --device 'iPhone 17' \
  --attach 'MyApp' \
  --output /tmp/myapp-profile.trace \
  --time-limit 30s
If that combination doesn’t work locally, record separate traces.
Once it’s saved, open the trace in Instruments:
open /tmp/myapp-profile.traceThis is usually the least painful iOS workflow:
- record via CLI
- inspect in Instruments
- take screenshots from the saved trace
Android Studio Profiler
Android Studio Profiler is the Android side of the same idea.
It’s useful for inspecting:
- CPU activity
- memory usage
- frame rendering issues
- UI thread activity
- network behavior
The workflow is pretty similar:
- Launch the app on an emulator or device
- Open Android Studio
- Open the
Profiler - Select your app process
- Start a system trace or CPU recording
- Perform the exact flow
- Stop and inspect the results
SpeedScope and Perfetto
Sometimes Xcode and Android Studio are not the nicest places to inspect a saved trace.
That’s where tools like SpeedScope and Perfetto help:
- SpeedScope for interactive flamegraphs
- Perfetto UI for timeline-style trace inspection
chrome://tracingfor Chrome’s tracing viewer
They’re especially handy when:
- you exported trace data from another tool
- you want to share traces with teammates
- you want a cleaner flamegraph view
Margelo’s react-native-release-profiler
Another useful tool is Margelo’s react-native-release-profiler.
This is useful when you want to answer a more specific question:
what is Hermes / JS doing in a real release build?
That matters because debug builds can distort the results. The project calls out things like debug markers, debugger overhead, and GC behavior being different enough to mislead you.
The basic usage looks like this:
import { startProfiling, stopProfiling } from 'react-native-release-profiler';

startProfiling();

// Perform the flow you want to measure
const path = await stopProfiling(true);
You can then process the trace and inspect it in SpeedScope, Perfetto or another supported tool.
I tend to use this as:
- a follow-up tool when debug results look suspicious
- a release-build JS / Hermes profiler
- another source of evidence when you’re comparing before / after changes
What to record
For each run, note:
- The branch you’re on
- simulator or device model
- OS version
- build type (release or debug)
- exact flow used
- fresh launch or reload
- trace filename
- React profile filename if exported
From native tooling, note:
- total CPU samples or overall CPU hot spots
- worst hang duration
- number of hangs
- top call stack hot spots
- whether the UI thread was dominant
- whether Hermes GC was significant
- leak count or suspicious memory growth
From React DevTools, note:
- number of commits
- slowest commit
- components rerendering during the flow
- whether rerenders happened only on mount or also on later interactions
Comparing before / after
Your comparison should be based on exact runs, not just whether the screen felt a bit nicer.
Example table:
| Metric | Before | After | Change |
|---|---|---|---|
| Worst hang | 6865ms | 407ms | -94.1% |
| UI hangs | 1 | 2 | lower severity |
| CPU samples | 77105 | 63898 | -17.1% |
| Leak groups | 85 | 80 | -5.9% |
| Slowest React commit | 148ms | 42ms | -71.6% |
Common mistakes
The mistakes I try to avoid are:
- comparing different user flows
- measuring only once
- trusting debug-build numbers too much (lots of optimizations get applied to release builds)
- assuming every slowdown is a React rerender problem
- assuming every slowdown is a UI thread problem
- not writing down device, build type and trace file names
- trying to optimize before proving where the time is actually going
A practical routine
If you just want the short version, this is the routine:
- Pick one exact flow
- Run React DevTools Profiler and capture the flow
- Capture native evidence on iOS with Instruments or
xctrace - Capture native evidence on Android with Android Studio Profiler
- If needed, inspect exported traces in SpeedScope or Perfetto
- If debug results look suspicious, profile a release build with
react-native-release-profiler - Record the numbers in a small before/after table
That combination is usually enough to get a pretty accurate picture of what is actually going on.